




































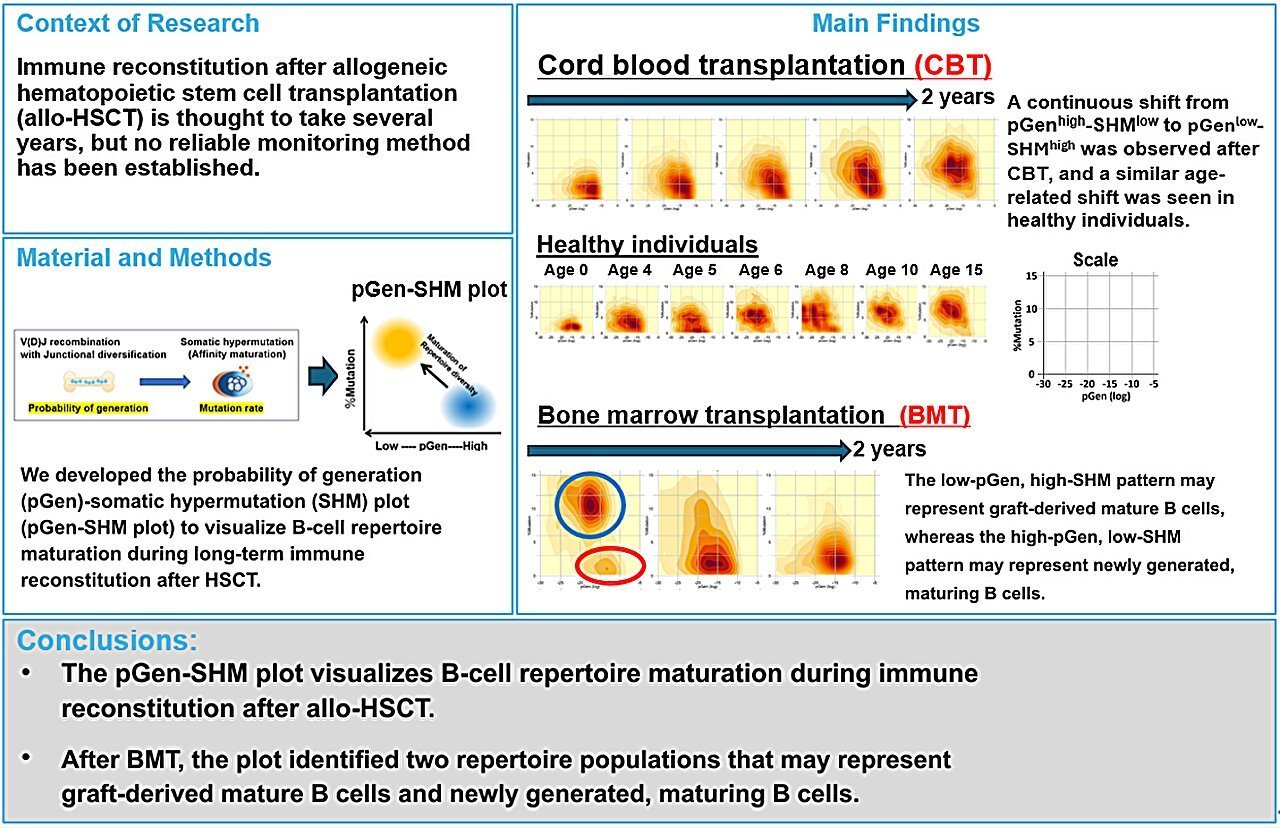
B-cell repertoire analysis visualizes humoral immune maturation after hematopoietic stem cell transplantation. Credit: Funakoshi Yohei et al., Blood Immunology & Cellular Therapy (2026) 2 (4): 100080.
A research team led by associate professors Yohei Funakoshi and Kimikazu Yakushijin and Professor Hironobu Minami of the Division of Medical Oncology/Hematology at Kobe University Hospital, together with Associate Professor Goh Ohji of the Division of Infectious Disease Therapeutics and Takaji Matsutani of Anymics Inc., has developed the pGen-SHM plot.
The method combines the generation probability (pGen) of individual B-cell receptor (BCR) sequences with somatic hypermutation (SHM) associated with antigen-driven maturation. This enables the visualization and objective assessment of the maturation of the BCR repertoire after allogeneic hematopoietic stem cell transplantation (allo-HSCT).
After cord blood transplantation (CBT), an initially immature repertoire shifted over approximately two years toward a pattern resembling that of healthy adults.
By contrast, the plots showed two distinct populations early after bone marrow transplantation (BMT): one with low pGen and high SHM and a second with high pGen and low SHM. These patterns were consistent with contributions from mature B cells in the graft and from maturing B cells newly generated from hematopoietic stem cells.
The pGen-SHM plot visualized features that were not apparent from conventional diversity indices. With further clinical validation, it may provide a new way to monitor humoral immune reconstitution after transplantation.
The findings were published online in Blood Immunology & Cellular Therapy.
In allogeneic hematopoietic stem cell transplantation, immunity acquired through previous vaccination or infection may be substantially reduced or lost. Patients are therefore at increased risk of serious infection after transplantation, and understanding how immunity recovers is important for infection prevention and revaccination.
Because antibodies play a key role in protection against many pathogens and in response to vaccination, monitoring the recovery of humoral immunity is particularly important. Recovery of humoral immunity is considered to indicate adequate immune reconstitution and to reflect broader recovery of the immune system.
Conventional assessments rely largely on immune-cell counts or IgG levels, but these cannot fully show whether a broad population of B cells capable of responding to pathogens has developed and matured. In contrast, the BCR repertoire, namely the complete collection of BCR sequences present in an individual, records aspects of B-cell generation, antigen encounter, selection and maturation.
While previous repertoire analyses have examined conventional diversity indices, clone-size distributions and CDR3 length, the optimal computational approach for accurately evaluating immune status has remained unclear. The research team therefore asked whether this information could be used to visualize humoral immune reconstitution after transplantation.
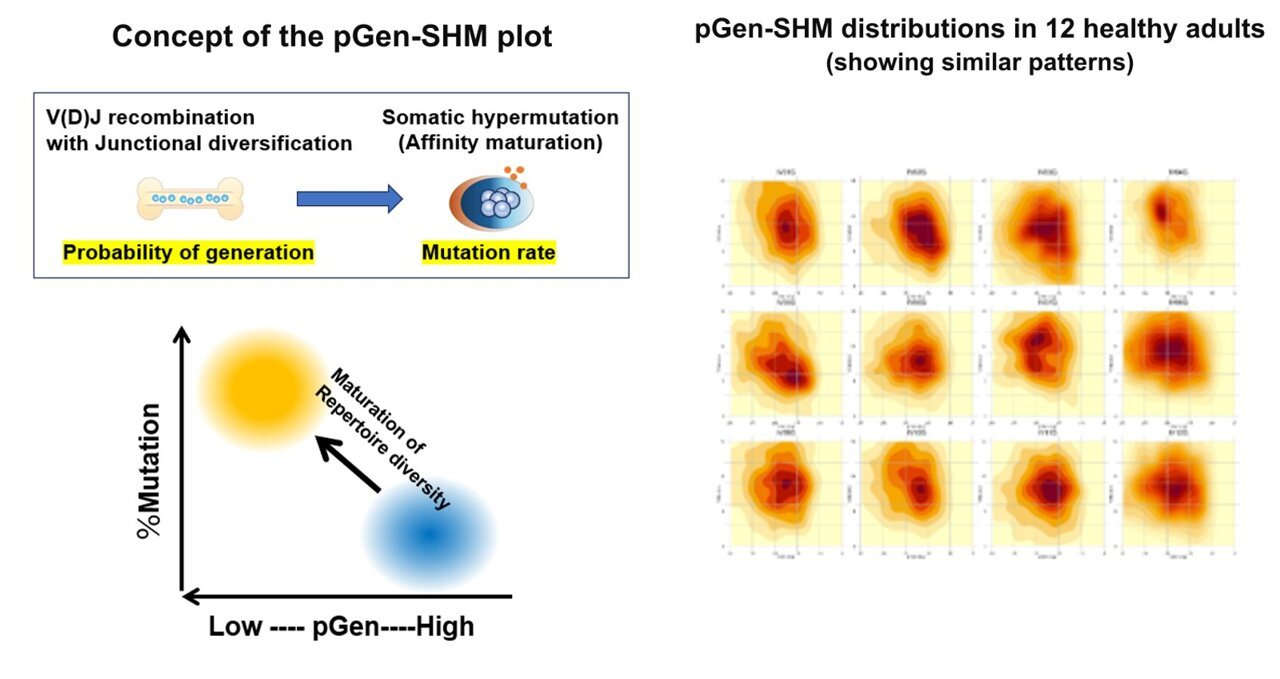
The pGen-SHM plot combines the generation probability (pGen) of BCR CDR3 amino-acid sequences on the horizontal axis with the somatic hypermutation (SHM) rate on the vertical axis. We believe that repertoire maturation is reflected in a shift from high pGen/low SHM toward low pGen/high SHM. The pGen-SHM distributions from 12 healthy adults showed broadly similar overall patterns. Credit: Funakoshi Yohei et al., Blood Immunology & Cellular Therapy (2026) 2 (4): 100080.
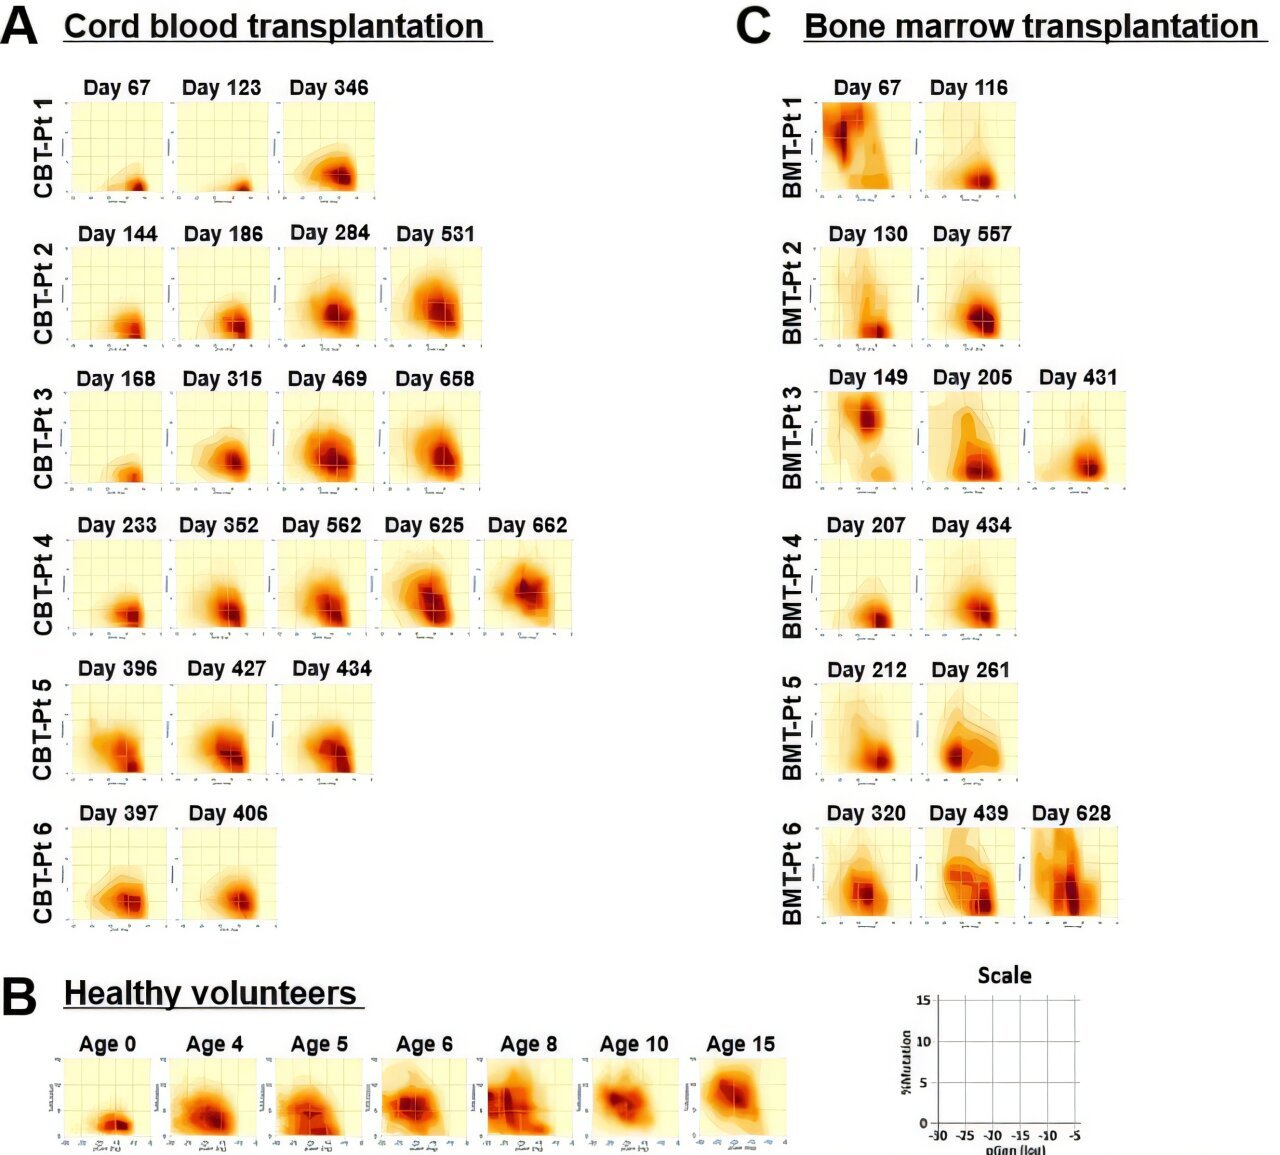
A, Six CBT recipients (21 samples) showed a continuous shift toward low-pGen and high-SHM. B, Healthy individuals aged 0-15 years in a public dataset showed a similar shift with increasing age. C, Longitudinal plots from six BMT recipients (14 samples); two distinct populations were observed in the three samples obtained within 180 days after transplantation. Color intensity represents the distribution of BCR sequences across pGen (horizontal axis) and SHM (vertical axis). Credit: Funakoshi Yohei et al., Blood Immunology & Cellular Therapy (2026) 2 (4): 100080.
Integrating BCR generation and maturation along two axes
BCR repertoire diversity arises mainly through two processes. First, V(D)J recombination generates a large variety of receptor sequences. For each CDR3 amino acid sequence, the researchers calculated pGen, an estimate of the probability that the sequence would arise through this recombination process.
Second, after antigen stimulation, mutations accumulate in the variable regions of immunoglobulin genes and B cells with improved antigen binding may be selected. The SHM rate was used as an indicator of this affinity maturation process. The pGen-SHM plot places each BCR sequence in this two-dimensional space and uses kernel density estimation to show the distribution of the repertoire through color intensity.
The team hypothesized that a relatively immature repertoire would contain more readily generated sequences with little SHM, thereby producing a high-pGen, low-SHM distribution, and that repertoire maturation may be reflected in a shift of the distribution toward lower pGen and higher SHM.
A, pGen-SHM plots from three samples obtained within 180 days after BMT.
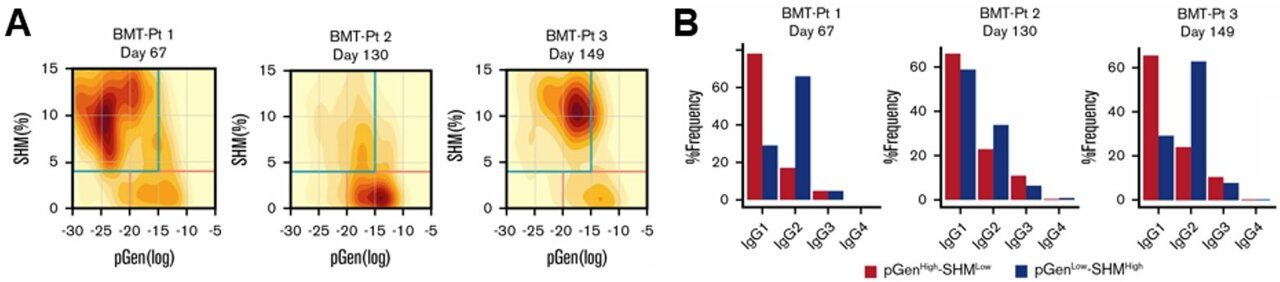
Blue outlines mark the low-pGen, high-SHM region and red outlines mark the high-pGen, low-SHM region. B, IgG subclass frequencies in the two regions. IgG1 was relatively more abundant in the high-pGen, low-SHM region, whereas IgG2 was relatively more abundant in the low-pGen, high-SHM region. Credit: Funakoshi Yohei et al., Blood Immunology & Cellular Therapy (2026) 2 (4): 100080.
Tracking repertoire maturation for approximately two years
The team longitudinally analyzed peripheral blood BCR repertoires from six patients who underwent CBT at Kobe University Hospital (21 samples collected 67–662 days after transplantation) and six patients who underwent BMT (14 samples collected 67–628 days after transplantation).
Early after CBT, the BCR sequence distribution was concentrated in the high-pGen, low-SHM region. Over approximately two years, the distribution shifted continuously toward low pGen and high SHM and approached the range observed in healthy adults.
Publicly available BCR data from healthy individuals aged 0–15 years showed a shift in the same direction with age. This similarity supports the pGen-SHM plot as a candidate measure of repertoire maturation. By contrast, conventional diversity indices did not show a clear relationship with time after transplantation in either transplant group.
Two distinct populations early after bone marrow transplantation
Within the first 180 days after BMT, three samples collected on days 67,
130 and 149 showed clear low-pGen, high-SHM and high-pGen, low-SHM populations. The low-pGen, high-SHM population was no longer apparent by approximately six months, whereas the high-pGen, low-SHM population tended to shift in the direction of maturation, similar to the pattern observed after CBT.
Detailed analysis of these three early samples showed relatively more IgG1 in the high-pGen, low-SHM region and relatively more IgG2 in the low-pGen, high-SHM region.
These findings support the biological distinction between the two regions and are consistent with the possibility that the low-pGen, high-SHM population included mature B cells transferred with the bone marrow graft while the high-pGen, low-SHM population included maturing B cells newly generated from hematopoietic stem cells.
Further developments
The pGen-SHM plot captured both continuous repertoire maturation and distinct populations coexisting within a sample, features that were difficult to discern using conventional single measures. The team aims to evaluate the method as a practical biomarker of humoral immune reconstitution through the following studies:
Prospectively following larger numbers of patients and examining the effects of conditioning regimens, immunosuppressive therapy, graft-versus-host disease, corticosteroids, B-cell-depleting therapy and other clinical factors. Combining flow cytometry, cell sorting and single-cell analysis to determine the cellular origins and functions of the populations observed on the plot.
Following sufficient clinical validation, the approach may also be useful for evaluating B-cell repertoire responses in settings beyond transplantation, including vaccination, infectious disease, cancer immunity and autoimmune disease.
More information: Yohei Funakoshi et al, B-cell repertoire maturation as a biomarker for immune reconstitution after hematopoietic stem cell transplantation, Blood Immunology & Cellular Therapy (2026). DOI: 10.1016/j.bict.2026.100080
Provided by Kobe University
Source: MedicalXpress
Original article: https://medicalxpress.com/news/2026-10-bone-marrow-transplant-analysis-reveals.html








Post comments