
byPaul Arnold, Medical Xpress
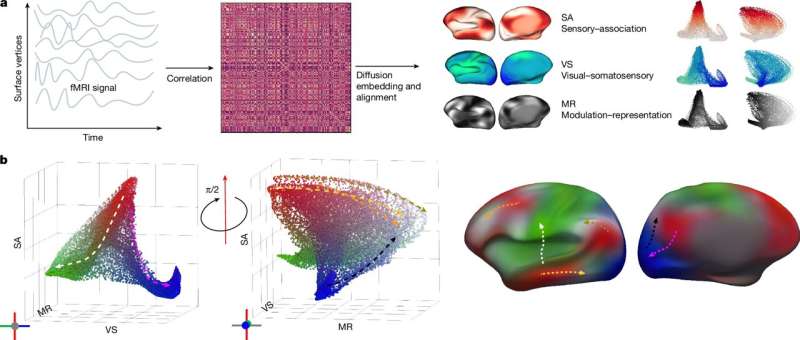
Overview of gradient manifold computation and its interpretation.a, For each individual, the fMRI signal is mapped to the cortical surface and an FC matrix is computed using the Pearson correlation coefficient. Individual FC gradients are obtained through diffusion embedding applied to the FC matrix, and are aligned to the template gradient axes of interest: SA, VS and MR. These axes, respectively, differentiate cortical locations by their implication in association (red) versus unimodal (white), their preferential recruitment in either visual (blue) or somatosensory (green) domains and their propensity to engage in top-down modulation (white) versus representation (black).b, The taxonomy of the adult gradient manifold in the embedding space (left) and the cortical surface (right) with a unified color map that combines the three used ina. Several paths along the gradient manifold are shown with corresponding color-coded paths along the cortical surface, demonstrating the cortical realization of hierarchies enumerated by the gradient manifold. Credit:Nature(2026). DOI: 10.1038/s41586-026-10219-x
If you want to know more about how the human brain matures and changes over time, you can now consult the first comprehensive atlas that maps brain organization from infancy all the way through to advanced old age. To create this comprehensive guide, researchers analyzed brain scans from 3,556 healthy individuals, ranging from newborns who were just 16 days old to centenarians. They used a technique called resting-state fMRI to see which parts of the brain communicate with each other while a person is lying still.
The scientists then converted this communication data into patterns called functional connectivity gradients, as they describe in a paper about their workpublishedinNature. These show the functional organization across the brain, rather than just its fixed physical structures.
A high point on a gradient represents regions involved in complex, abstract thinking, while a low point corresponds to regions dedicated to basic sensory processing, like sight or touch. By using this system, anyone looking at the atlas can quickly see which parts of the brain are working together and how that coordination changes over time.
How the brain changes
The team used their atlas to look at how these patterns shift across the human lifespan. They discovered that the mostdramatic reshapingoccurs during the first four years of life. Here, the brain is dominated by basic sensory systems like sight and touch. As a child grows into an adult, the hierarchy sharpens and the regions responsible for complex thought become more distinct and specialized.
As we move into old age, these clear boundaries begin to change again. The sharp distinctions between different areas start to blur, which means the brain becomes less specialized as it ages.
"Gradient architecture is anchored by primary sensory systems in infancy, differentiates along association and control axes during childhood and adolescence, and gradually dedifferentiates during aging," write the team in their paper.
Universal template
The atlas is effectively a template for how a healthy brain should develop and age, which can serve as a useful reference for doctors to spot early signs of neurological conditions. It could also be a valuable tool for researchers, as the team notes: "Theselifespan gradientsunify diverse research into developmental brain connectivity and provide a shared multimodal reference for future studies."
By establishing a universal standard, the atlas could allow researchers worldwide to compare their research against a single consistent model.
© 2026 Science X Network
Publication details Hoyt Patrick Taylor et al, Functional hierarchy of the human neocortex across the lifespan, Nature (2026). DOI: 10.1038/s41586-026-10219-x Journal information: Nature


Post comments